Summary

Apex Gantt Chart

View your project time schedule in Gantt format with the Apex Gantt chart visual. Easily import your data from Primavera P6® or Microsoft Project® and build and customize the Gantt Chart to share it with project stakeholders. Apex Gantt offers outstanding features such as comparing up to three versions of the project schedules in Gantt view, dynamic data date, flexible timeline and many more.

Key Features

Unlimited levels of activities

Display activities based on the project WBS with no limit on the number of levels

Milestones

Start and finish milestones are determined automatically

Baselines

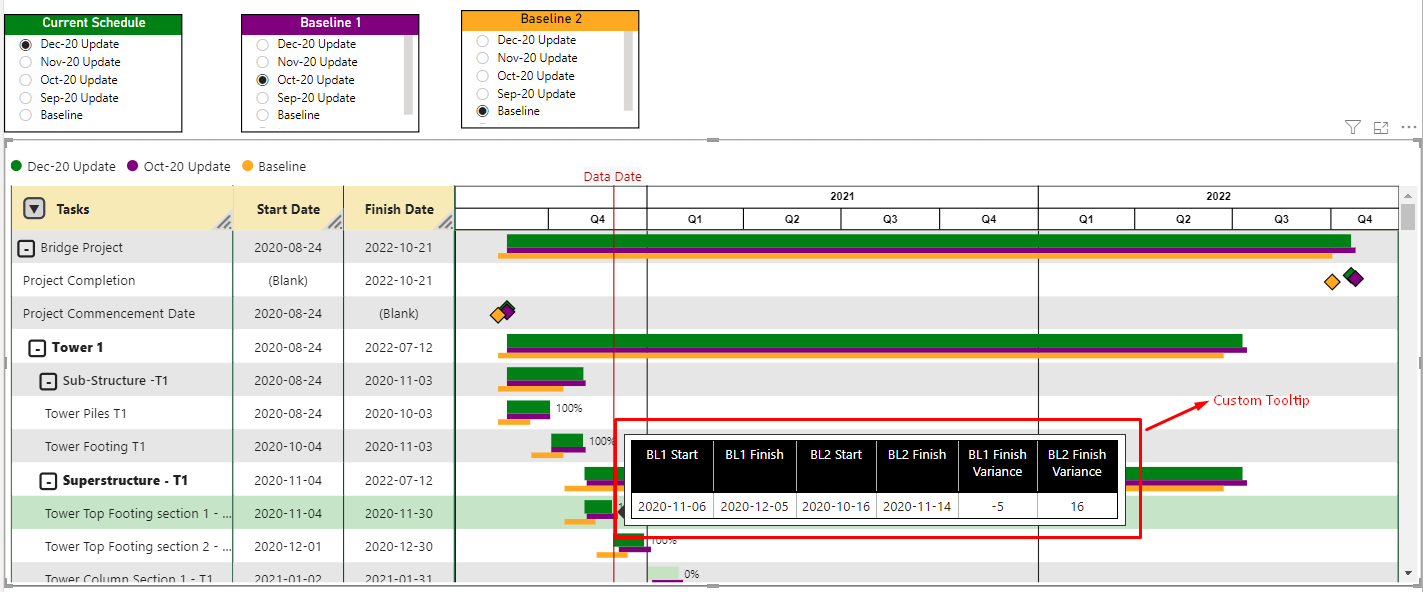
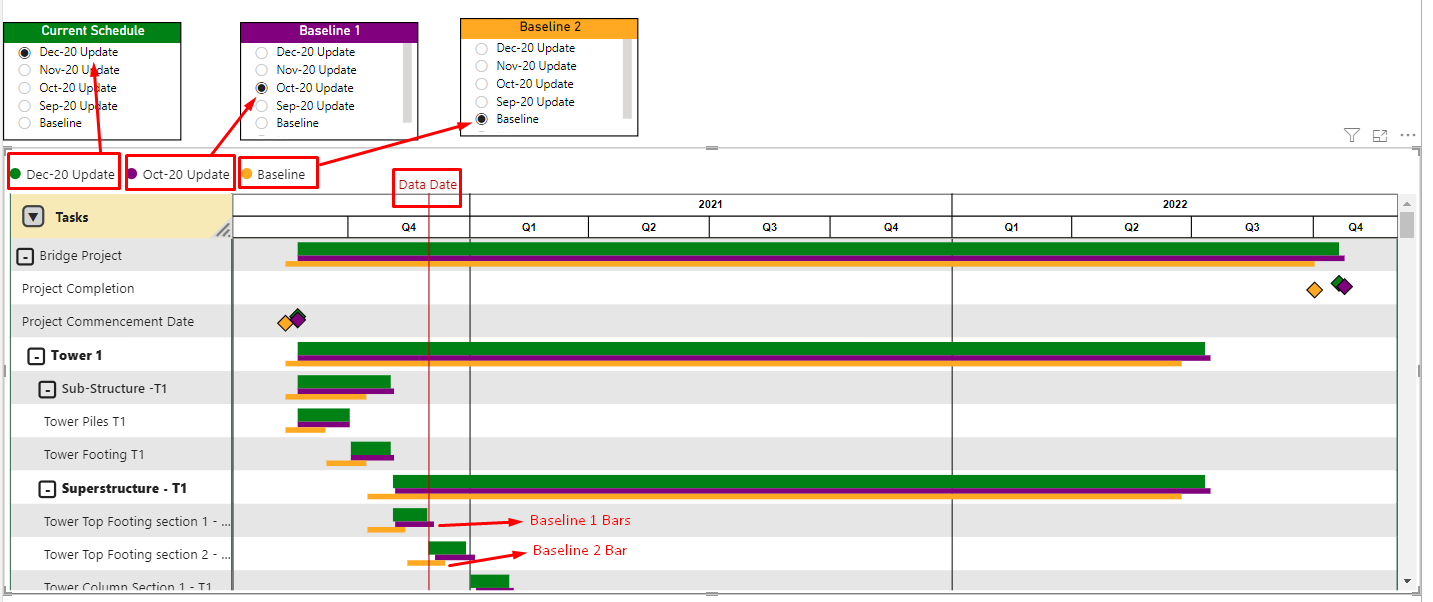
Display up to two baselines with the current schedule

Gantt Chart formatting

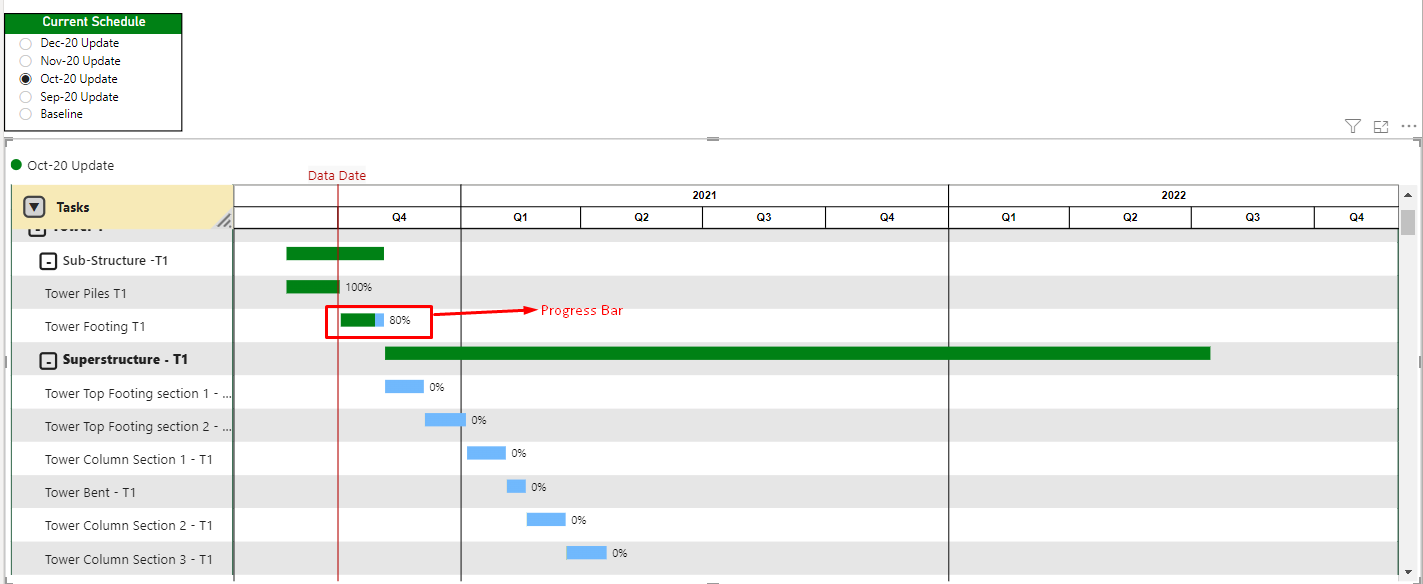
Customize gridlines, use dynamic data date, progress bar and Custom Tooltips

Customizable formatting and legend

Define different colors for activities, milestones and legend

Performance

Displaying an unlimited number of project tasks without affecting the visual performance

Additional Columns

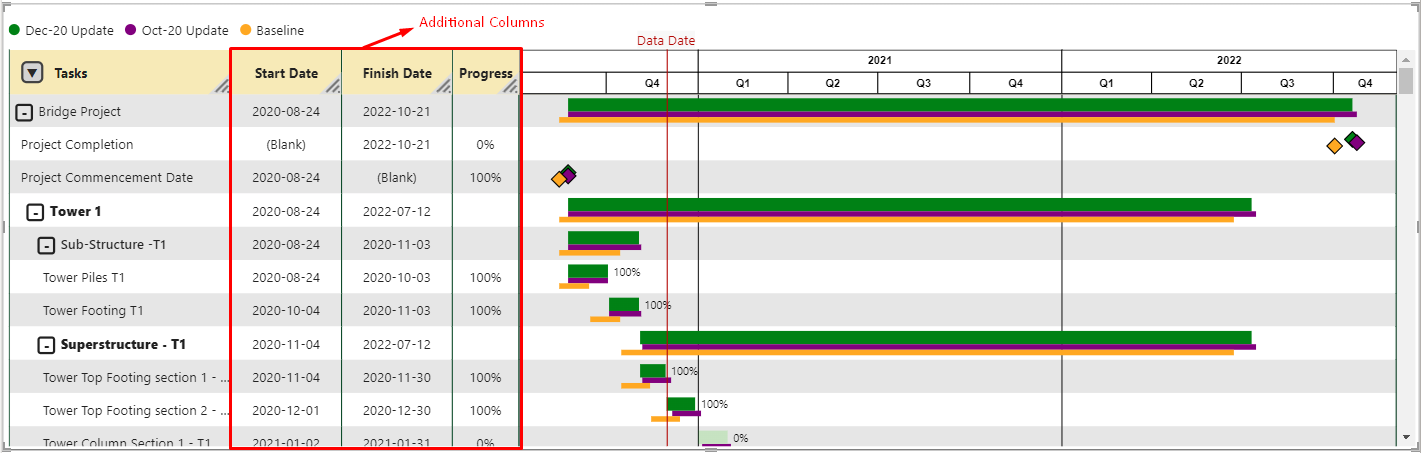
Add columns for Start, Finish or Progress beside the Gantt chart

Multiple Timelines

Define three (3) timeline levels e.g. year, quarter, month, week, etc.

Video Tutorial

You can find a short video covering our visual’s functions and features.
Play Video

Purchasing

Download the free trial or purchase the Apex Gantt chart directly from Microsoft
We focus on helping organizations with innovative tools and solutions in data analysis.